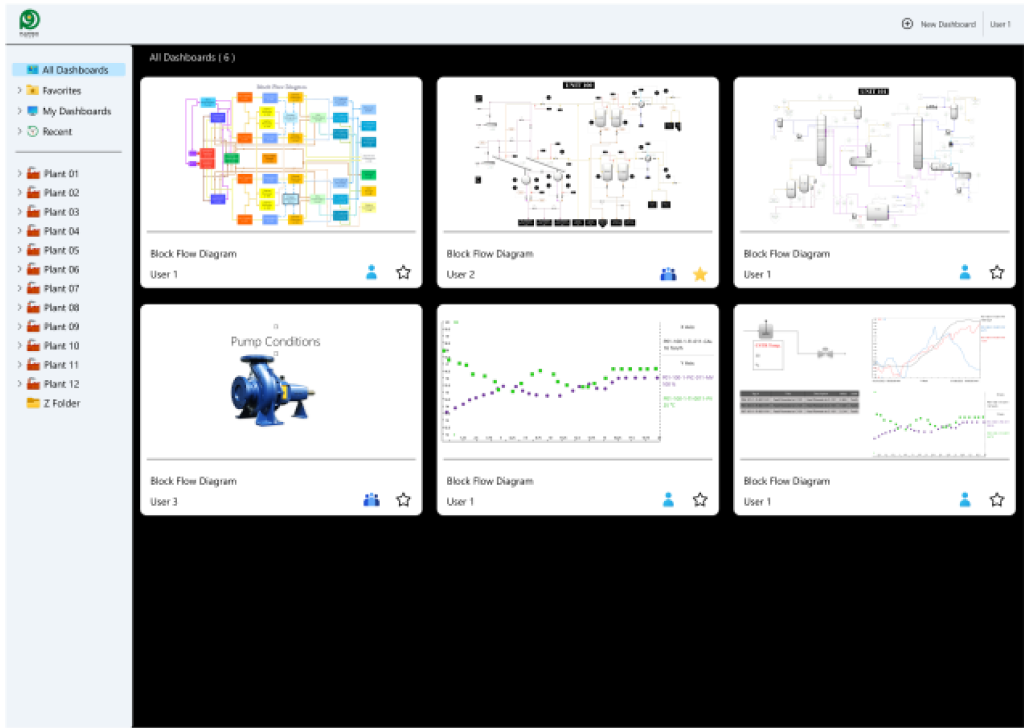
In PDMS module, all data store in a database, including DCS system tags, Log Sheet information (recorded and reported by operators), laboratory test results, and outputs of calculations from different engineering discipline (calculated based on other available data), and can be presented in various ways either individually or in combination on a single page such as:

- Time-based charts depicting different indices (Y vs. Time) with single or multiple vertical axes (Single or Multi Axis).
- Flexibility to adjust chart properties such as color, thickness, and tag names, alongside displaying chart values by interacting with the charts.
- Charts displaying various indices based on different tags (Y vs. X).
- Creation of diverse schematics with customizable details on the page and inclusion of various tag types (DCS, Log Sheet, Laboratory, Calculations) with their respective values.
- Various table formats available for reporting any existing tag along with its minimum, maximum, and average values.
- Incorporation of different gauges on the display page, each linked to a specific tag, and the ability to define color indicators within specified data ranges of interest.
Furthermore, any engineering computations based on existing tags can be implemented and saved on the desired pages within this module. It’s important to note that users can share their designed pages publicly, allowing other module users to utilize them as needed.


